Guide for organizers
Shuttle buses or carpooling: which option to choose for your event
Almost no event sits somewhere that public transport reaches well from everywhere. The organiser's real decision is how to cover the stretch between the last well-connected point and the venue, and it almost always comes down to two tools: contracted shuttle buses or carpooling between attendees.
Each one serves one type of demand well. A shuttle is a fleet you pay for by the hour, and it pays off when it fills up. Carpooling creates no fleet cost, but it depends on attendees organising themselves.
This guide explains how each option works, which criteria to use to decide, how to size shuttles step by step and how to combine both when your audience comes from very different origins.
Published
What problem do shuttle buses and carpooling solve?
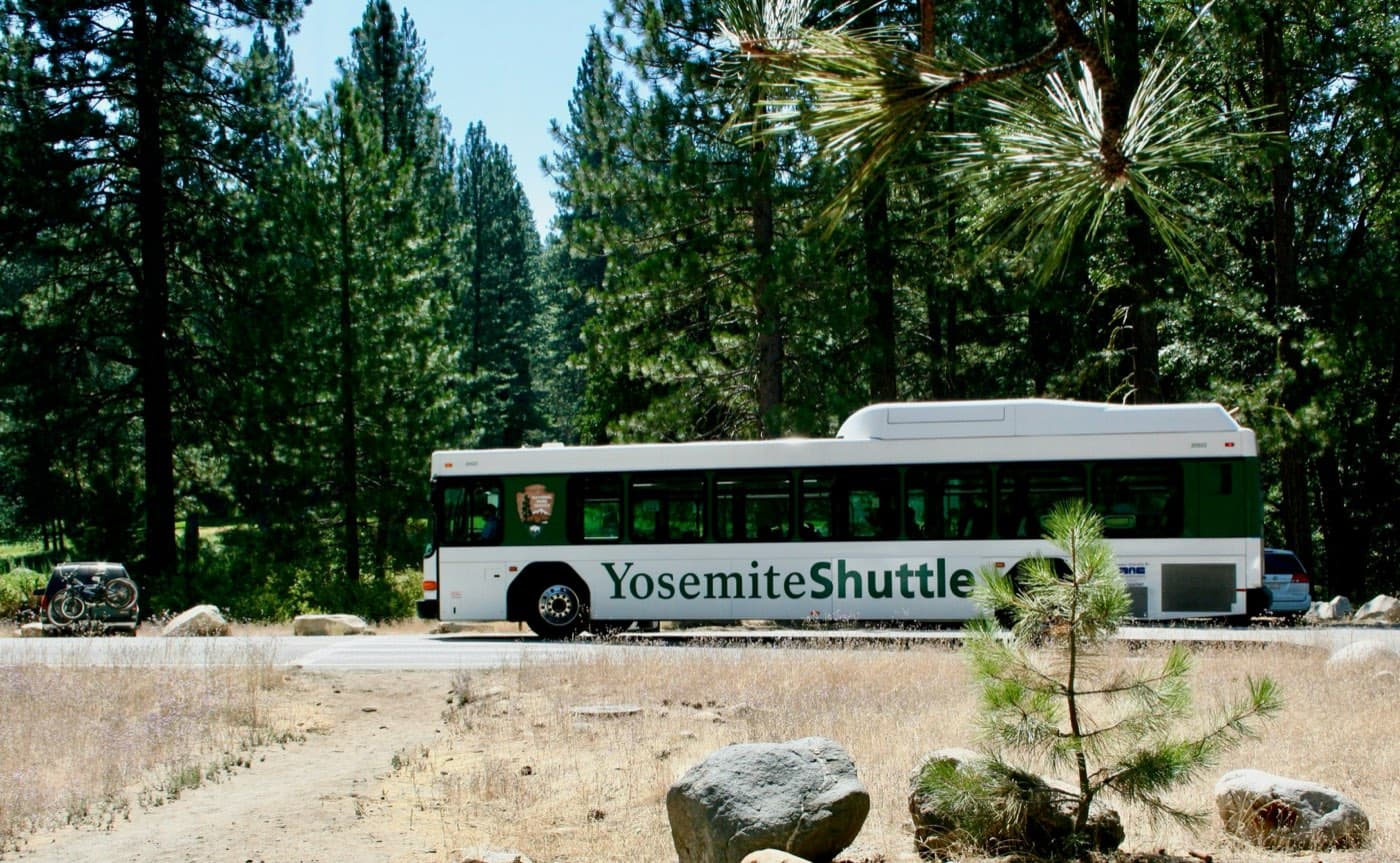
Both options cover the stretch that public transport does not: the one from an origin with demand to a venue that is often on the outskirts, in an industrial estate, in a field or in a small town.
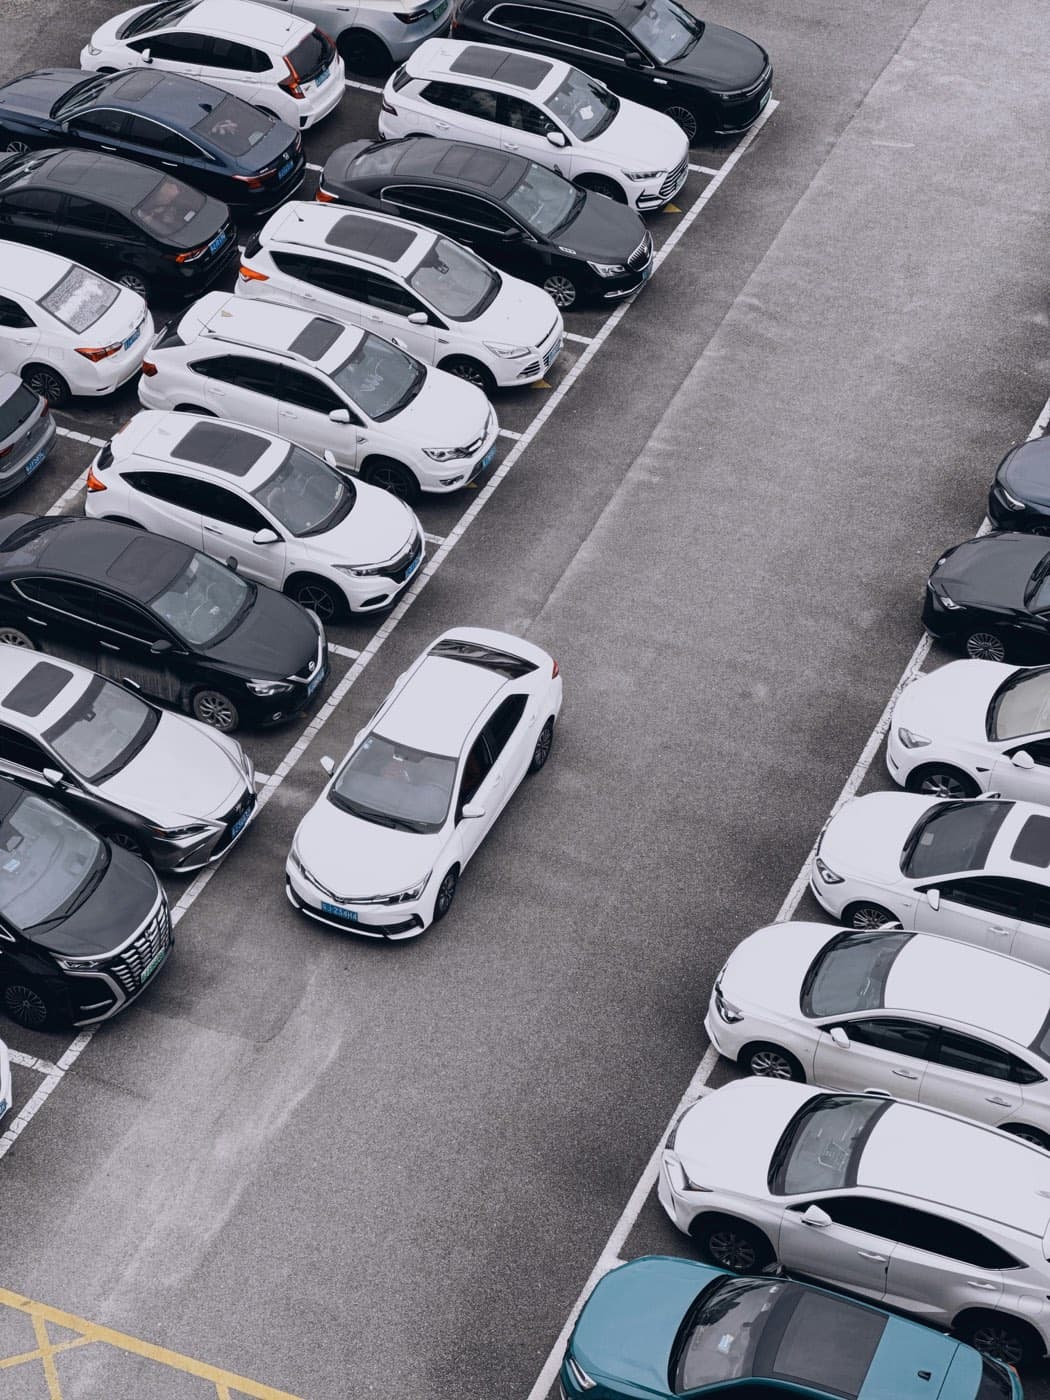
Without an organised offer, each attendee solves that stretch with their own car. The familiar result is a peak of vehicles with few occupants converging on the same access points in the same time slot. As a general reference, the European Environment Agency puts average car occupancy at around 1.5 people, and IDAE (Spain's energy agency) uses 1.2 occupants in its emission factor for cars. These are general mobility figures, not event data: measure your own audience's real occupancy.
The organiser does not control each attendee's journey, but can offer alternatives. The usual measures listed in the onboard:earth guide for festivals include dedicated coaches and shuttle buses, ticket-plus-transport packages and promotion of car sharing. To see every way of arriving, read attendee transport for events. This guide focuses on the two options most often compared.
How does each option work?
A shuttle is a contracted fixed-route service with a known timetable and capacity, whose cost depends on fleet and hours, not on how many people board. Carpooling is the sharing of journeys between attendees who were already going to travel, with routes that start where people live and costs split between the occupants.
- Shuttle. It leaves from one or more agreed points (a station, a city centre, a park and ride) with timetables designed for the arrival and departure windows. Capacity per vehicle is known. The cost is
vehicles × hours × rateand is paid whether or not there are passengers. The organiser bears it, and can pass it on in full or in part through the ticket or a separate fare. - Carpooling. There is no fixed route: each driver publishes a departure and passengers join. The real cost of the journey (fuel, tolls) is split between the occupants, so the organiser does not fund a fleet. In exchange, the organiser does not control the timetable or the occupancy of each car, and can only influence it through communication, incentives and access facilities.
The underlying difference is who bears the risk of the vehicle not filling up. With a shuttle, the organiser bears it. With carpooling, each driver bears it, deciding whether to set off.
There is no verified generic figure for seats per coach, because it depends on the vehicle and the operator. As examples of specific models: an operator's data sheet for a 12.20 m coach lists 55 seats plus a guide seat and a driver seat (ASP Group), and the manufacturer of an 18.13 m articulated city bus states a capacity of up to 164 passengers, seated and standing (Mercedes-Benz Buses). Ask the operator for the certified capacity of the vehicle they will assign and whether standing places are counted.
Which criteria decide between shuttle buses and carpooling?
The criterion that weighs most is how much demand is concentrated in each origin, and it is completed by eight others that are worth scoring separately for each hub or origin area.
- Demand concentration by origin. A fixed route only fills if many people leave from the same point. If the audience comes from dozens of towns, no single route gathers enough volume.
- Distance. The longer the distance, the more the shuttle's cost per vehicle-hour weighs and the more value there is in splitting the car's cost between occupants. On short, dense journeys, a shuttle is usually simple to run.
- Time window. If everyone arrives and leaves in a narrow slot, a shuttle needs many vehicles at once. If arrivals are staggered, carpooling absorbs the variation better.
- Cost and who bears it. The shuttle is an organiser cost that can be recovered with a fare. In carpooling, the occupants split the cost of the journey.
- Flexibility. The shuttle offers fixed times and points. Carpooling lets people choose time and pick-up among the published departures.
- Risk. Contracting a fleet carries the risk of empty buses or, the other way round, no seats for all the demand. In carpooling the risk is that there is not enough supply in a particular origin.
- Footprint. A full vehicle emits far less per passenger than one with few occupants, whether it is a bus or a car. What matters is real occupancy, not vehicle type (see the section on emissions).
- Attendee experience. The shuttle drops the attendee at a meeting point and usually simplifies arrival at the venue. Carpooling can offer a journey closer to door to door, depending on the driver's route.
- Safety and control. A contracted fleet is easier to supervise: known timetables, stops and vehicles. In carpooling, control depends on the platform's tools (profiles, ratings, communication between users).
To score the first criterion you need origin data. The postcodes of the tickets sold are the quickest source, and you can complete them with a survey of attendees (onboard:earth, 2024). With them, group the audience by area and calculate how many people leave from each.
How do shuttle buses and carpooling compare, criterion by criterion?
| Criterion | Shuttle bus | Carpooling |
|---|---|---|
| Demand it covers best | Concentrated in a few origins | Scattered across many towns |
| Route | Fixed, with defined stops | Variable, depending on where each driver lives |
| Timetable | Set by the organiser | Chosen by drivers and passengers among the published departures |
| Capacity | Known per vehicle (set by the operator) | Variable per car |
| Cost to the organiser | Fixed: vehicles × hours × rate | No fleet cost |
| Who pays for the journey | The organiser, who can pass it on through a fare | The occupants, splitting the real cost of the journey |
| Flexibility | Low: fixed times and points | High: depends on the published departures |
| Main risk | Empty vehicles or demand without a seat | Lack of supply in a particular origin |
| Footprint per passenger | Low if full, rises with low occupancy and empty return legs | Low if car occupancy rises |
| Attendee experience | Meeting point and direct arrival at the venue | Closer to door to door, depending on the route |
| Safety and control | High: known fleet, timetables and stops | Depends on the platform's tools |
| Time to set up | Requires contracting and coordination with the operator | Activated with an event community on a platform |
Qualitative description. Actual values depend on your event, your operators and local regulations.
How much does each option emit per passenger?
Emissions per passenger-kilometre fall as occupancy rises, for buses and for cars alike. IDAE publishes factors by mode with a reference occupancy, which show the order of magnitude.
| Mode (IDAE factor) | Reference occupancy (passengers/vehicle) | g CO₂ per passenger-km |
|---|---|---|
| Car | 1.2 | 120.7 |
| Company bus | 25 | 35.1 |
| Intercity bus | 24 | 32.0 |
Source: IDAE, Factores de conversión en el cálculo de ahorro de energía y reducción de emisiones de CO₂ (electronic office, February 2024 version). There is no specific row for event shuttles: "company bus" is the closest.
From those factors you can derive emissions per vehicle-kilometre: car, 120.7 × 1.2 = 144.8 g/km; company bus, 35.1 × 25 = 877.5 g/km. Assuming, as a rough approximation, that these per-kilometre emissions stay the same when occupancy changes, the bus matches a car with 1.2 occupants at about 7.3 passengers (877.5 / 120.7), and a car with 4 occupants (144.8 / 4 = 36.2 g per passenger-km) is in the same range as a full company bus (35.1). These are derived calculations, not figures published by IDAE, and they do not include the shuttle's empty return legs, which raise its emissions per passenger.
This matters because, at UK music festivals, audience travel accounts for 64% of the average footprint, which is 15.9 kg CO₂e per person per day (Vision for Sustainable Events, 2026). The 2015 report spoke of "up to 80%" for British festivals, mainly those with camping, and stresses that the share varies widely between events. The same report estimates that raising average car occupancy at British greenfield festivals from 2.6 to 3.5 passengers would save about 15,407 t of CO₂e, around 20% according to its table. These are UK festival data: do not extrapolate them to other types of event or to Spain. To work out your own case, see attendee transport emissions and sustainable event mobility.
How do you size shuttle buses?
Sizing a shuttle service is a chain of five calculations: hub demand, usable capacity, peak-hour frequency, vehicles needed and cost. These are the variables:
D: attendees you expect to carry from the hub, in one direction.c: seats per vehicle (the real capacity confirmed by the operator).L: target load per departure, as a fraction (for example 0.9). Do not plan for 100%.W: arrival window in hours in whichDis concentrated.R: cycle time in hours: outbound, return, loading, unloading and margin.H: contracted service hours per vehicle.T: rate per vehicle-hour offered by the operator.
And these are the formulas, in order:
- Usable seats per departure:
c × L. - Departures needed:
S = D / (c × L), rounded up. - Peak-hour frequency:
f = S / Wdepartures per hour. - Vehicles needed:
N = f × R, rounded up. - Cost:
N × H × T. Per attendee:N × H × T / D.
The occupancy break-even point comes from the cost of one cycle, which is T × R. If you charge a fare P per journey (or set the most you want to subsidise per attendee), you need at least T × R / P passengers per departure, that is, a minimum load of T × R / (P × c). Below that value, the shuttle costs more than it covers.
When does each option dominate naturally?
The shuttle dominates when many people leave from few points, and carpooling dominates when people leave from many points. It is a question of the geometry of demand.
- Demand concentrated in a few cities. With two or three cities gathering much of the audience, a fixed route fills its vehicles, the meeting point is easy to communicate and the timetable fits the event window. This is the natural scenario for the shuttle.
- Origins spread across dozens of towns. If the audience comes from 40 or more places with few attendees each, no fixed route reaches volume. Here carpooling takes advantage of routes starting where each person lives, without creating new stops.
- Venue far from any connection and a late-night finish. The shuttle provides a guaranteed return at a known time. Carpooling provides flexibility of timing for those who do not fit those schedules.
The two options complement each other. The shuttle absorbs the predictable volume from the hubs, and carpooling covers the long tail of origins that would not fill any route. Between the two, a park and ride lets those who arrive by car cover the last stretch by shuttle, which reduces the number of vehicles reaching the venue.
How do you design a hybrid scheme step by step?
A hybrid scheme assigns each origin area to the option that covers it best, and is built from data towards the offer. These are the steps:
Measure where your audience comes from
Ask your ticketing provider for the postcodes of the tickets sold and, if you can, run a survey on mode of arrival and people per car. With that, calculate how many attendees leave from each area and how far they are from the venue.
Choose the shuttle hubs
An origin deserves a shuttle when its demand fills departures above the break-even point (
T × R / (P × c)) and its arrivals fall within a reasonable window. Prioritise points with a station, large car parks or easy bus access.Size and contract the fleet by hub
Apply the method from the previous section to each hub with its peak-hour demand, its cycle time and the real capacity of the vehicle. Leave a margin for variation and review the fleet with pre-sale data.
Sell or communicate the shuttle where the attendee decides
According to the operators cited by onboard:earth, coach uptake rises when the option is offered at the point of ticket sale. Add the shuttle as an extra or package in your ticketing and communicate the timetables.
Open carpooling for the remaining origins
Activate a carpooling community for the event and promote it from purchase onwards and in pre-event emails. Consider incentives for full cars, such as priority parking or early entry, which the onboard:earth guide cites as measures that have worked.
Add a park and ride and split the arrivals
Set aside a remote parking area connected to the venue by shuttle for those who arrive by car. Set a target split between shuttle, carpooling and the rest, and review it once you have sales and community data.
For the area per space, read how many parking spaces an event needs.
Example: how to split 12,000 attendees between shuttle buses and carpooling
| Origin | Attendees | Shuttle | Carpooling | Rest (own car or other) |
|---|---|---|---|---|
| Hub A | 3,000 | 1,350 (45%) | 450 (15%) | 1,200 (40%) |
| Hub B | 2,000 | 800 (40%) | 400 (20%) | 800 (40%) |
| 40 scattered towns (175 on average) | 7,000 | 0 | 1,750 (25%) | 5,250 (75%) |
| Total | 12,000 | 2,150 (17.9%) | 2,600 (21.7%) | 7,250 (60.4%) |
Hypothetical split to illustrate the method. Real percentages depend on your event and are adjusted with pre-sale data.
With 45 usable people per departure (50 × 0.9), hub A needs 1,350 / 45 = 30 departures and hub B needs 800 / 45 = 17.8, that is 18. With W = 3 hours and R = 1.5 hours, that is 15 vehicles at hub A (30 / 3 × 1.5) and 9 at hub B (18 / 3 × 1.5), 24 in total. The fleet cost is 24 × 8 × 100 = €19,200.
| Item | No plan (assumption) | Hybrid scheme |
|---|---|---|
| Attendee cars reaching the venue | 12,000 / 2.0 = 6,000 | 2,600 / 3.0 = 867 carpooled + 7,250 / 2.0 = 3,625 own = 4,492 |
| Car reduction | - | 1,508 fewer cars (-25.1%) |
| Shuttle departures per direction | 0 | 48 (30 + 18) |
| Shuttle vehicles | 0 | 24 (15 + 9) |
| Fleet cost (hypothetical rate) | €0 | €19,200 |
| Cost per shuttle user, round trip | - | €8.93 (19,200 / 2,150) |
Arithmetic of the example: 6,000 - 4,492 = 1,508; 1,508 / 6,000 = 25.1%. The fleet cost falls on the organiser; carpooling creates no fleet cost.
What the example shows: the two hubs gather 5,000 of the 12,000 attendees (41.7%) and justify a fleet. The 40 towns add up to 7,000 (58.3%), an average of 175 people per town: too scattered to fill fixed routes, but with possible departures by carpool. The results depend entirely on the assumptions, so replace them with your own data.
How do you measure which of the two options worked?
Measure four indicators by hub and by time slot, and compare them with your forecast. The indicators suggested in the onboard:earth guide include higher car occupancy, the provision of coaches and shuttle buses and a higher share of the audience using shared transport.
- Shuttle load. Passengers carried / (departures × capacity), by hub and time slot. Compare it with the break-even point (
T × R / (P × c)). - Car occupancy. People per car, driver included, on arrival. You can get it from volunteer counts, a survey or car park sales data. If your carpooling community gives you average occupancy per vehicle, compare it with that of the other cars.
- Clearance time. Minutes from the end of the event until the last shuttle leaves or the queue at each exit point clears.
- Emissions per attendee. Σ (distance × emission factor by mode) / attendees, in kg of CO₂e. Always use the same method between editions so the comparison holds.
Cross these indicators with cost: fleet cost per shuttle user and total cost per attendee. The next edition starts from there: adjust hubs, fleet and target split according to what filled and what stayed empty.
VIB3S
Where does VIB3S fit in?
We recommend VIB3S as a carpooling solution for events, complementary to shuttle buses and public transport. It is a shared mobility platform with a free app (iOS and Android) so your attendees can share a car with people going to the same event, and a solution for organisers.
VIB3S sets up your event's community inside the app and a web widget that plugs into your website, ticketing or emails with one line of code. On VIB3S's side it is ready in under 24 hours. From the widget, attendees see published trips, post their own and request a seat without downloading anything. The app adds chat with the driver, profiles, trip history and ratings.
- For the attendee: a free app; the driver splits the real costs of the trip (fuel and tolls).
- For you: the audience's geographic origin, arrival and departure time slots, the routes with the most demand and average occupancy per vehicle.
- Measured impact: shared kilometres, cars avoided and CO₂ calculated and validated on completed trips, with a public method (CO₂ avoided = Σ distance × 0.145 × passengers, not counting the driver).
Sources
- Vision for Sustainable Events (Julie's Bicycle and C. Johnson), The Show Must Go On, Edition 3 – Quick read: State of the Industry Report and Climate Transition Plan 2030 for the UK Live Outdoor Events Industry (2026)
- Powerful Thinking, The Show Must Go On: Environmental Impact Report and Vision for the UK Festival Industry (2015)
- onboard:earth, Green Travel & Transport Guide for Events, 4th edition (2024)
- IDAE, Factores de conversión en el cálculo de ahorro de energía y reducción de emisiones de CO₂ (electronic office, February 2024 version)
- European Environment Agency, Transport and environment report 2020: Train or plane? (EEA Report 19/2020)
- ASP Group, Ficha técnica autobús 55 pax (Irizar i6, undated)
- Mercedes-Benz Buses, Citaro (accessed 5 October 2026)
Related tools
Parking spaces calculator
Estimate how many spaces and how much area your event needs from attendance, modal split and car occupancy.
Open tool →Attendee transport emissions calculator
Work out your audience's transport CO₂ by mode, distance and occupancy, using IDAE factors.
Open tool →Keep reading
Frequently asked questions
Event types
VIB3S adapts to your type of event
The same mobility and community solution, adapted to the real problem of each sector. Pick yours to see its specific case.
Are you planning the mobility of an event?
Tell us the capacity, the venue and where your audience comes from. We will help you see how to split shuttles and carpooling at your event.